Note: Page 65 is blank.

The Guangzhou Intellectual Property Court ruled seven defendants liable for "virtual digital human" trade secret infring...

The Supreme People's Court ruled that patentees with valid patents and positive evaluation reports fulfill duty of care,...
Innovators and designers filed record-setting levels of applications for the intellectual property rights that protect their work in 2024, while demand for the trademarks that promote brands stabilized, according to WIPO’s World Intellectual Property Indicators (WIPI) report.
The WIPI provides an annual worldwide overview of filing activity in the areas of patents, trademarks, designs and other IP rights. It draws on statistics from around 150 national and regional IP offices.
According to the report, patenting activity grew 4.9 percent during 2024 in a fifth year of growth and global design filings rose 2.2%.Worldwide trademark applications showed signs of recovery following a two-year slowdown - ending the year essentially flat.
“In today’s competitive, global economy, innovation is a key driver of growth with IP at the center of many business strategies - whether protecting and promoting breakthrough technologies, trusted brands or eye-catching designs. The continued growth in IP filings also reflects strong confidence in the IP system and the efforts of governments, with WIPO’s support, to incentivize and strengthen innovation. Sustaining this trust requires ongoing global cooperation to ensure a robust and effective IP framework.”
——WIPO Director General Daren Tang
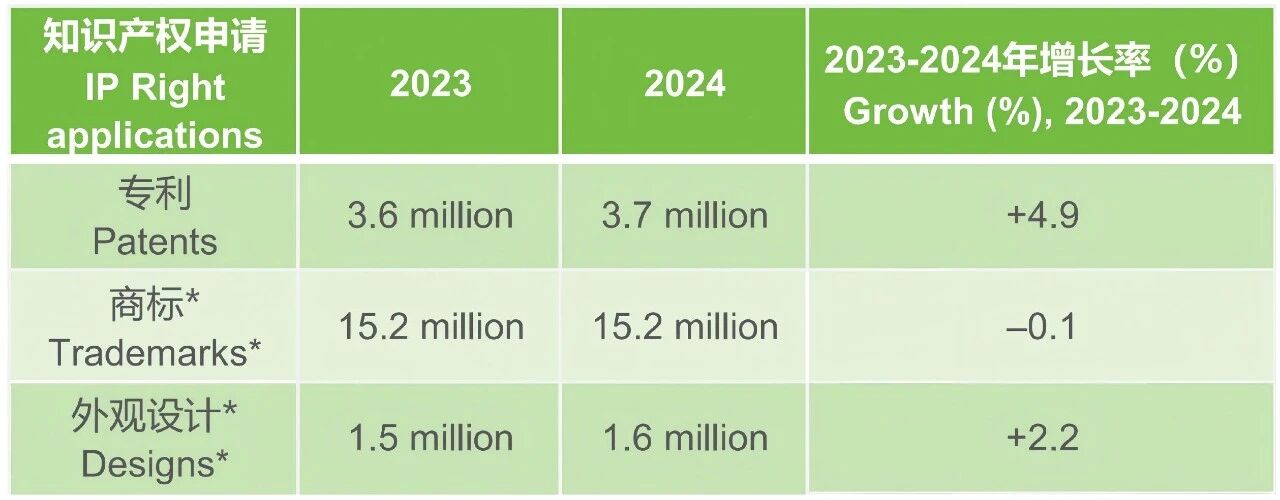
Note: *indicates trademark classes specified and designs contained in applications to allow for cross-border comparison, as some countries require individual filings for each class or design, while others allow for multiple classes/designs in a single filing.
Patents
Global patenting activity showed a record 3.7 million applications filed in 2024, a 4.9% increase from 2023 and a fifth consecutive year of growth. A substantial rise in patent filings by residents of China, India, the Republic of Korea and Japan were the main drivers of global growth in 2024.
Innovators residing in China (1.8 million), the US (501,831), Japan (419,132), the Republic of Korea (295,722) and Germany (133,485) led global patent filings.
Among the top 20 origins, India (+19.1%), Finland (+15.4%) and Türkiye (+14.6%) were the only three to record double-digit growth in 2024. For India, 2024 marked the sixth consecutive year of double-digit growth, driven primarily by a strong growth in resident filings. Finland, by contrast, recorded its second straight year of double-digit growth, due mainly to strong abroad filings. For Türkiye, overall growth in 2024 was likewise propelled by an increase in resident filings.
In 2023 – the latest year for which complete data are available owing to the delay between application and publication – computer technology emerged as the most frequently featured technology in published patent applications worldwide, accounting for 13.2% of the world total. It was followed by electrical machinery (7.2%), measurement (6.2%), digital communication (5.8%) and medical technology (4.9%). Among the top 10 fields of technology, computer technology (+10.3%) is the only field to have witnessed double-digit growth between 2013 and 2023. Filings related to measurement (+7.2%) and digital communication (+6.6%) also saw robust growth over the same period.
Trademarks
Global trademark applications showed signs of recovery following a two-year slowdown. Trademark filing [1] totaled 15.2 million classes, representing a slight 0.1% decline from 2023 compared to the steeper declines of the previous two years.
The highest volume of filing activity came from applicants based in China with a combined domestic and abroad application class count of around 7.3 million; followed by US applicants (836,457), those based in the Russian Federation (559,436), and applicants from India (532,900) and Brazil (436,291). Among the top five origins, Brazil (+10.4%), India (+7.4%) and the Russian Federation (+2.9%) experienced growth in filing in 2024, while both China and the US saw declines of 1.5% each. For Brazil, growth was driven by increases in both resident and abroad filing, whereas for India and the Russian Federation, the overall growth was solely due to an increase in resident filing.
Filings from 12 of the top 20 countries of origin increased in 2024, with notable increases for Argentina (+19.7%), Brazil (+10.4%) and Indonesia (+8.4%).
In 2024, the research and technology sector attracted the largest filing volumes by applicants seeking trademark protection abroad, constituting 19.3% of global reported non-resident trademark filing. It was followed by the health (14.1%), clothing and accessories (12.2%) and leisure and education (10.4%) sectors. Trademarks relating to agriculture (10.1%), household equipment (9.3%) and business services (9.1%) accounted for the next largest shares of the total. In contrast, industries linked to chemicals (3.2%), construction (5.4%) and transportation (6.9%) received the smallest proportions of filing abroad.
Industrial Designs
Global design filing activity [2] grew in 2024, rising by 2.2% to 1.6 million designs, with seven of the top 20 countries seeing double digit growth. With 906,849 designs in applications filed, applicants residing in China were the most active in the world in terms of design count in 2024. They were followed by applicants from Germany (70,212), the US (66,855), Italy (63,668) and the Republic of Korea (60,109). Together, these top five countries accounted for almost three-quarters (74.9%) of the global activity in 2024.
Among the top five origins, Germany (+7.9%) had the fastest growth in filings in 2024, followed by Italy (+5.2%) and China (+2.7%). In contrast, the US (–3.8%) and the Republic of Korea (–0.1%) saw declines.
The filing activity of 11 of the top 20 origins increased in 2024. The sharpest increases came from applicants from India (+44.9%), Morocco (+20.2%) and Indonesia (+18.9%).
In 2024, the sectors accounting for the largest shares of the world total were furniture and household goods (16.7%), textiles and accessories (16.7%), tools and machines (11.3%), ICT and audiovisual (9.2%) and electricity and lighting (8.9%). Together, these five sectors accounted for 62.8% of all classes recorded globally.
Footnotes
1 Trademark filing activity refers to the total number of classes specified in trademark applications.
2 Design filing activity refers to the total number of designs contained in industrial design applications.


 Home
Home


Comment